

Reports of the "Statistics" section
The "Statistics" section opens from the bot's menu. How to choose the period and the chart step and what the "Unique values" checkbox changes is on the overview page.
Activity
The tab has three charts. The header of each shows the total for the chosen period. If nothing happened during the period, "Empty" is written instead of the chart.
| Chart | What it counts |
|---|---|
| "Requests" | How many times the "Request" block fired in the scenario |
| "New visitors" | How many new contacts appeared — people who wrote to the bot for the first time, in any channel |
| "Clicks" | How many times links to the bot were opened — the general one and the additional ones, of all messengers together |
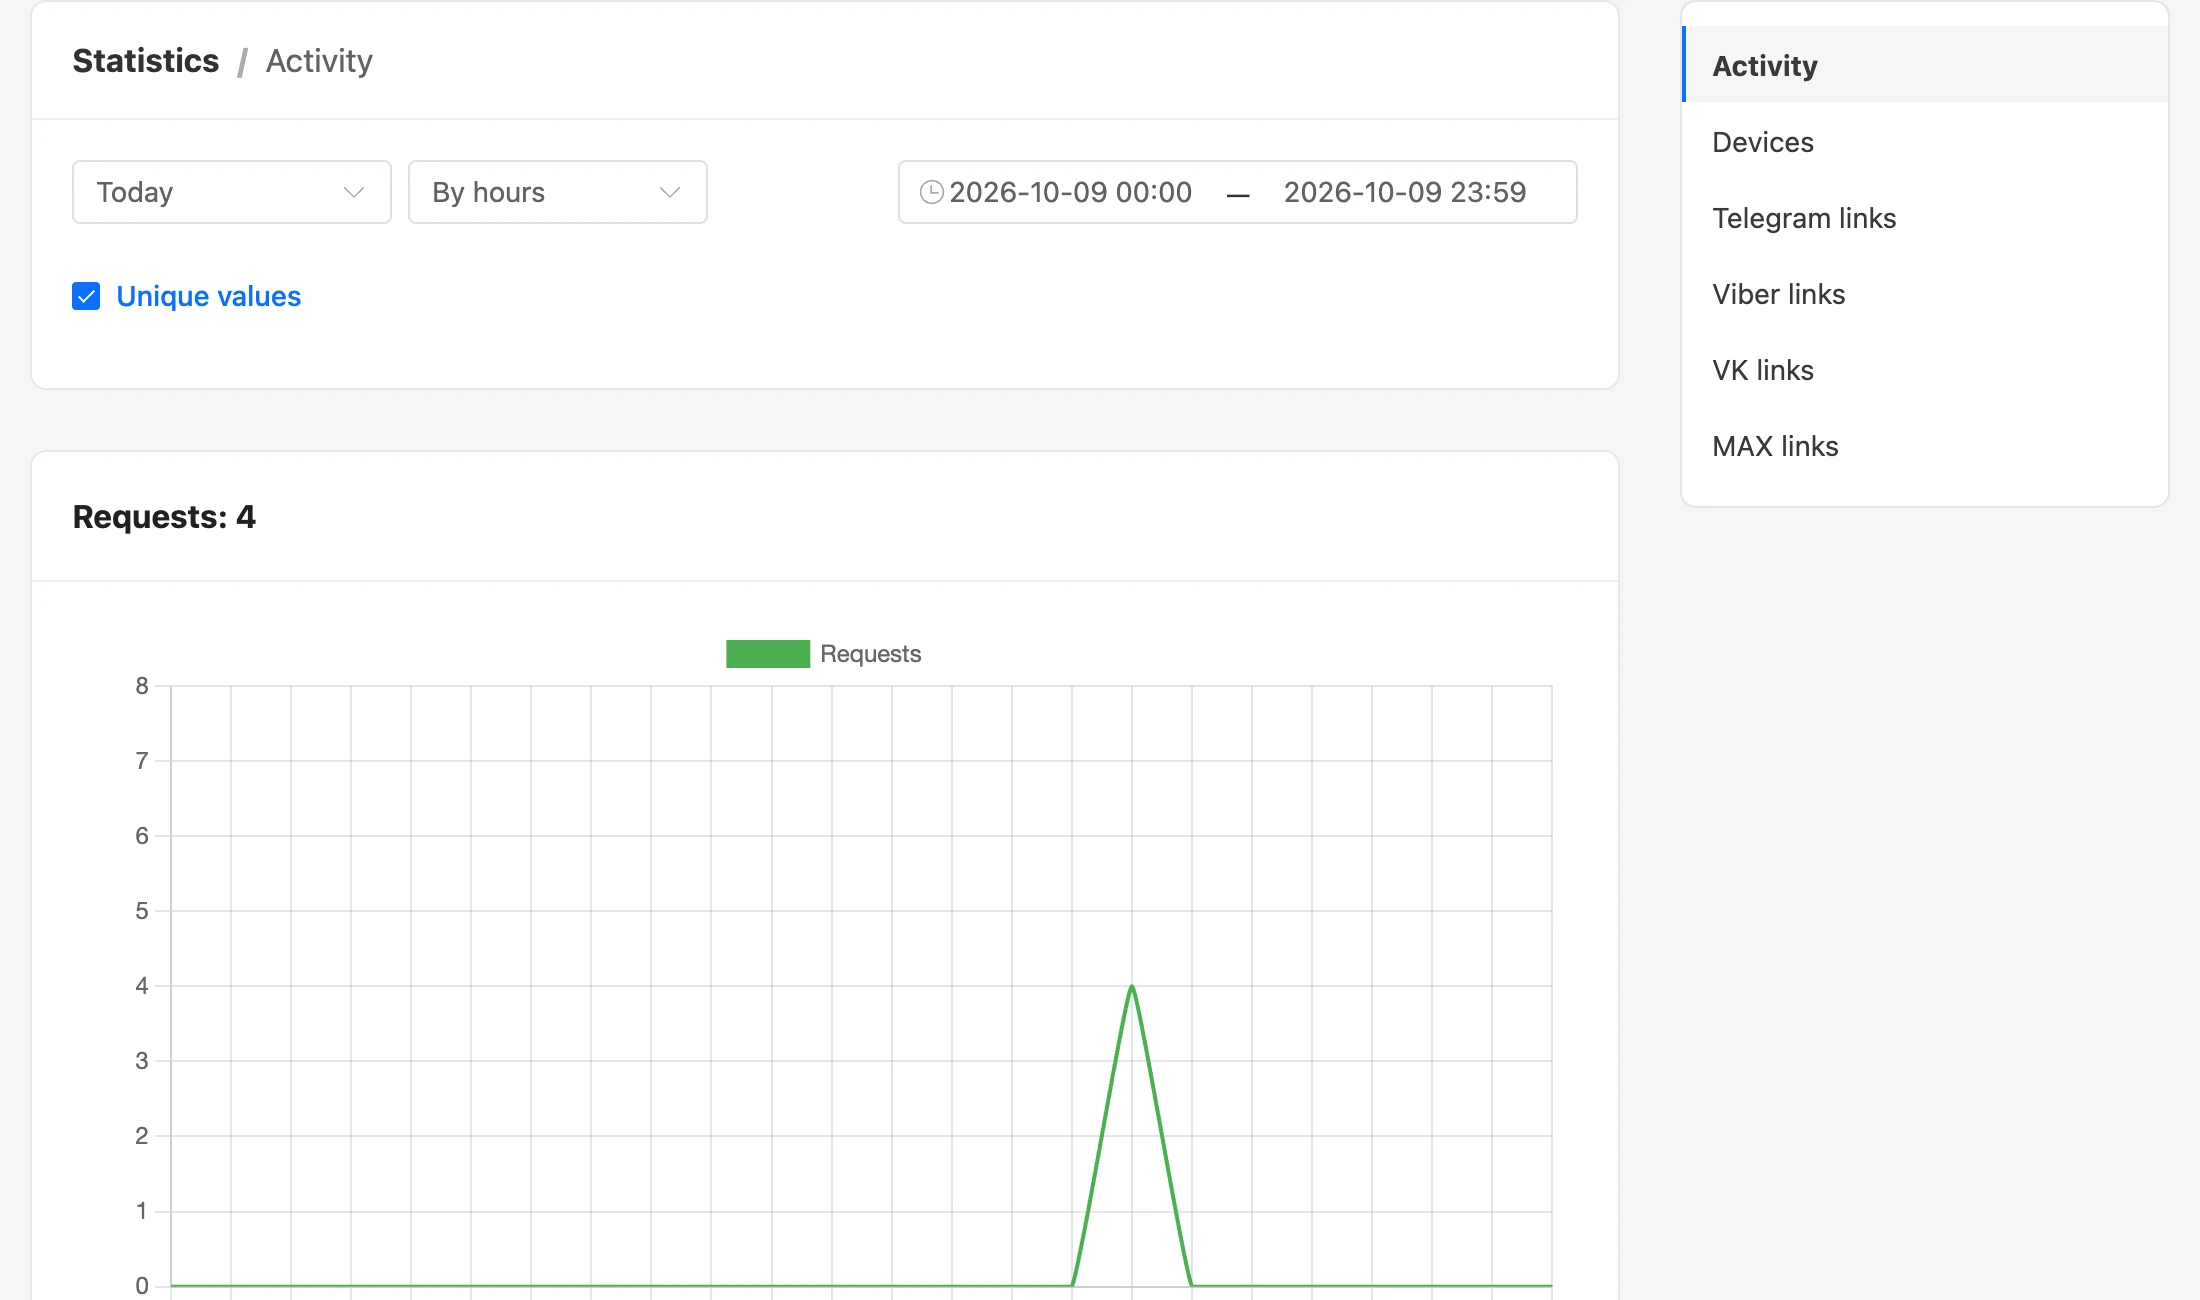
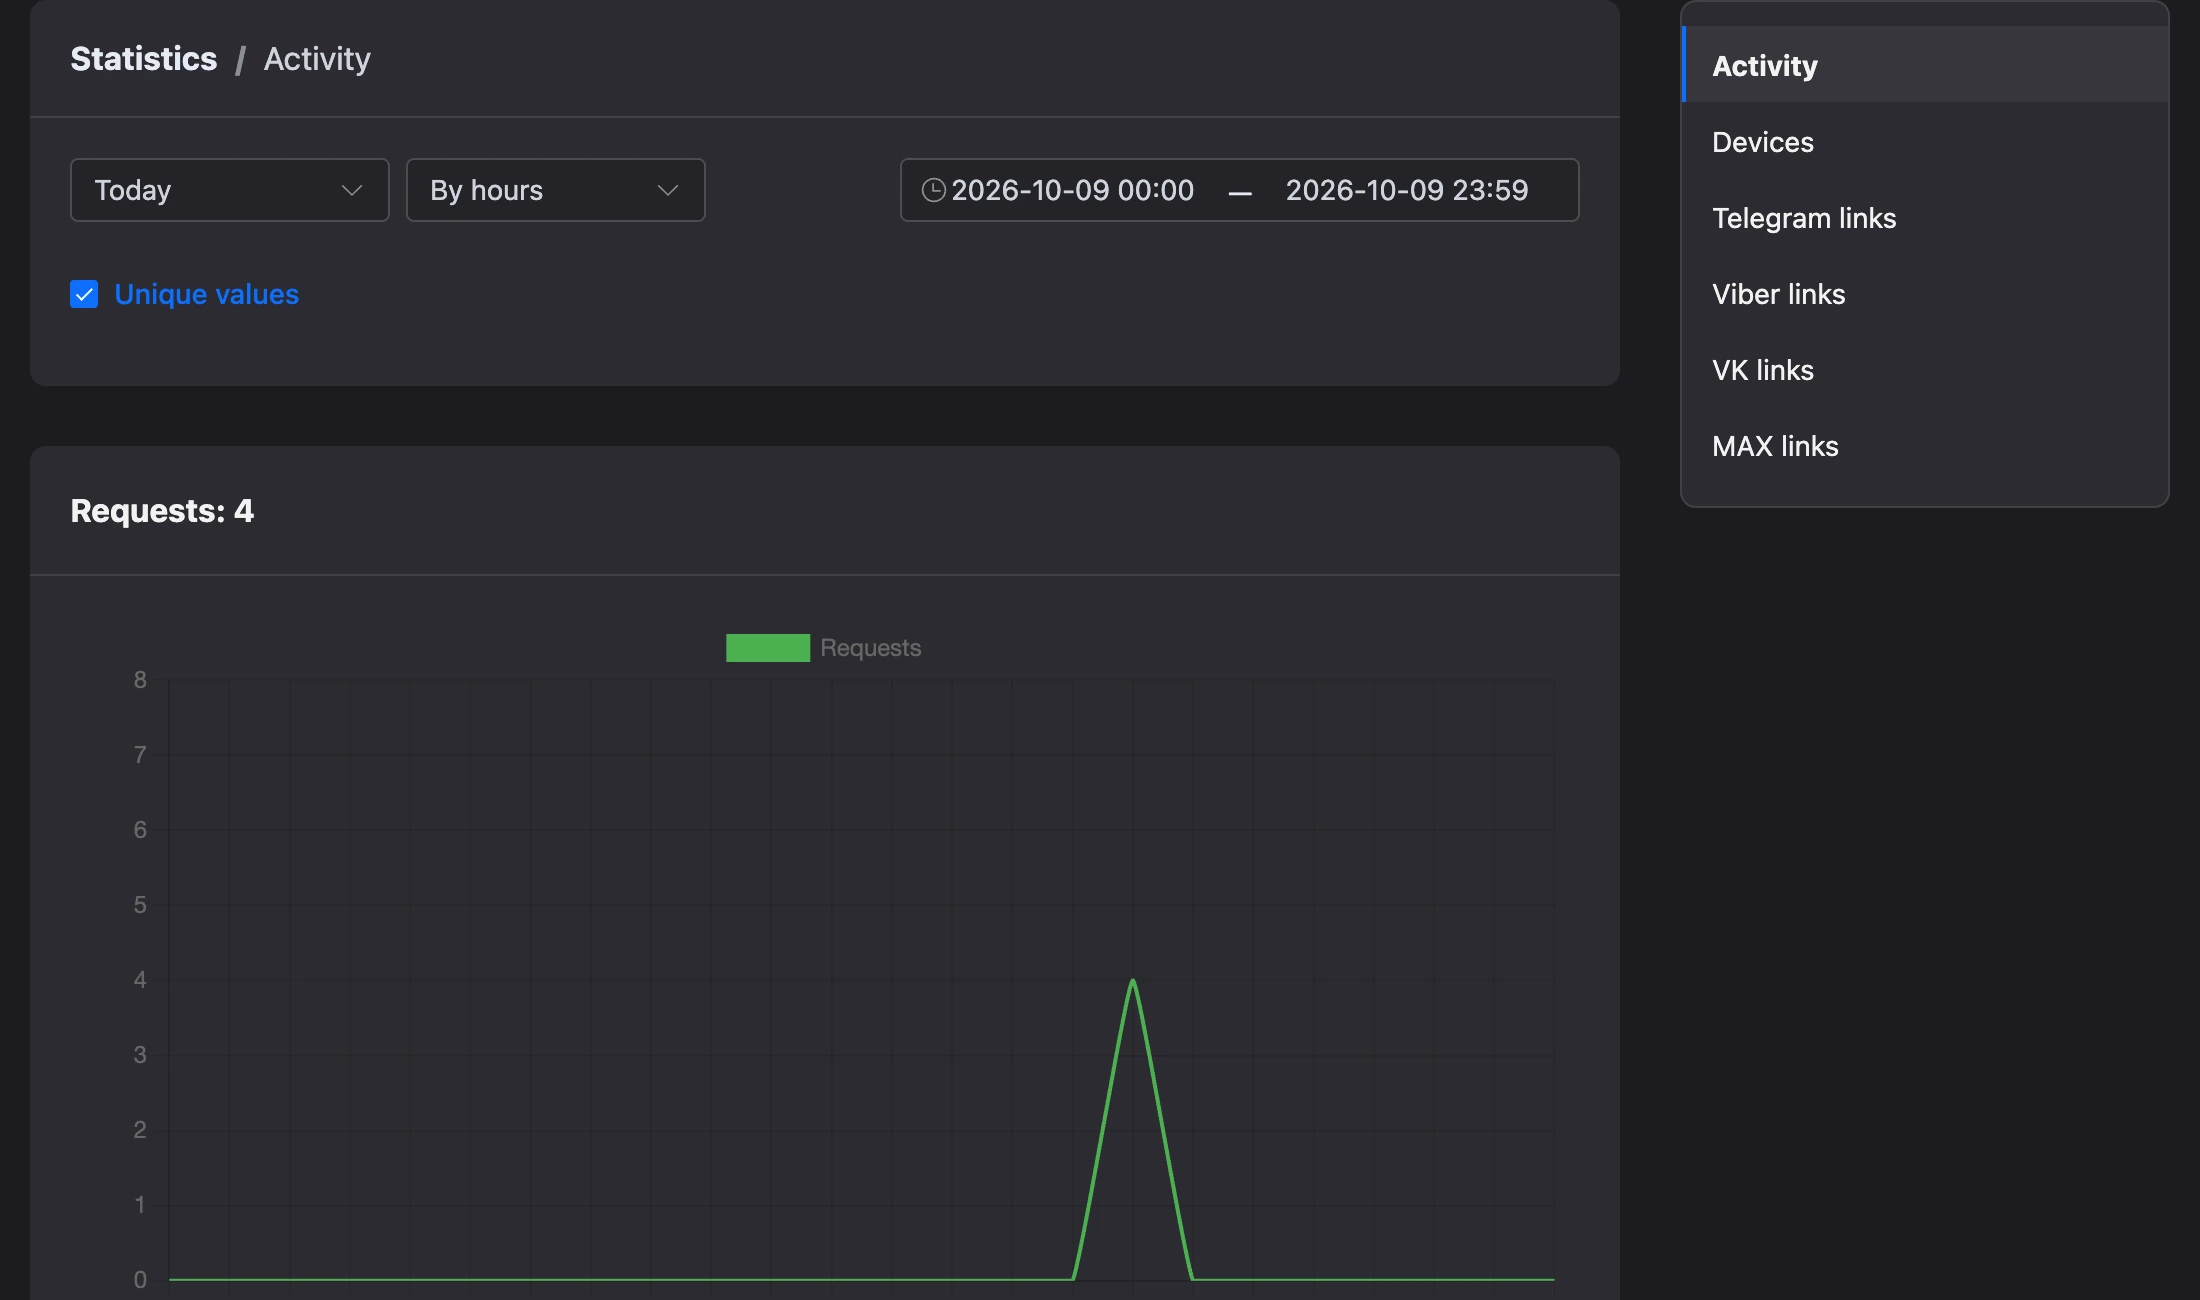
Together the three charts give the bot's funnel: people clicked a link → reached the bot and became contacts → left a request.
When the tab opens, the "Unique values" checkbox is on and the chart step is "By hours".
Note
"Requests" are counted by the "Request" block. If the scenario has no such block or no channel is turned on in it, the chart stays empty — even if people leave their contact details in another way.
Devices
Three pie charts with shares in percent:
- "Device type" — "Desktop", "Smartphones", "Tablets", "Bots", "Unknown";
- "Browser" — the browsers the link was opened from; unrecognised ones are gathered in "Other";
- "Platform" — operating systems; unrecognised ones are "Other".
The charts are built from clicks on the bot's links: this is the device on which a person opened the link, before moving to the messenger. Every person is counted once. This tab has no chart step and no "Unique values" checkbox.
Messenger links
The "Telegram links", "Viber links", "VK links" and "MAX links" tabs show the messenger's additional links with numbers for the chosen period. The tab's header shows how many links there are in total.
The table's columns:
| Column | What it shows |
|---|---|
| "Link" | The link's address |
| "Note" | Your note to the link |
| "Scenario" | The scenario the link starts; a click opens its scheme |
| "Clicks" | How many times the link was opened |
| "Requests" | How many people reached the bot in the messenger after the click |
| "Conversion" | The share of the second number in the first, in percent |
| "Creation date" | When the link was created |
Important
The "Requests" column in the table of links is visits to the bot, not firings of the "Request" block. In the "Links to chatbot" section the same number is labelled as visits.
When exactly a visit is counted depends on the messenger — this is described in the table on the Additional links page.
When the tab opens, the "Unique values" checkbox is off: every click and every visit is counted. Turn it on to count people rather than events.
A page shows 30 links. The messenger's general link is not in the table: its clicks are visible only in the overall "Clicks" chart on the "Activity" tab.
A link's chart
The chart icon at the end of a row opens a window with the chart of one link. It has two lines — "Clicks" and "Requests", and the legend of each shows the total for the period. The window has its own period, "Granularity" and "Unique values" checkbox; the "All time" period here is counted from the day the link was created.
The same window opens from the "Links to chatbot" section — there it shows the link's whole lifetime and unique values right away.
How to read the numbers
- Many clicks, few new visitors. People open the link but do not reach the bot. Check where the link leads and what a person sees first: in VK and Viber a page with a button opens before the bot, and with the policy turned on — in the other messengers too.
- Many visitors, few requests. People start the scenario but do not reach the "Request" block. Where exactly they stop is shown by the conversions on the scheme.
- A link's conversion is a dash. There turned out to be more visits than clicks, and the percentage makes no sense. This happens with the "Unique values" checkbox off, when one person starts the bot by the link several times.